Building an Ecommerce Analytics Dashboard for Sellers
Hey there! So, you’re sitting there sipping your coffee, and you keep hearing about this “ecommerce analytics dashboard.” You might be wondering: What exactly is that? And why should I care? Well, let’s break it down over our caffeine fix.
First off, let’s tackle a common misconception. Some people think that analytics dashboards are only for big corporations with fancy tech teams. But the truth is, anyone running an online store, big or small, can benefit from having a solid analytics dashboard. It’s like having a map for your business journey. Without it, you’re navigating blind.
What is an Ecommerce Analytics Dashboard?
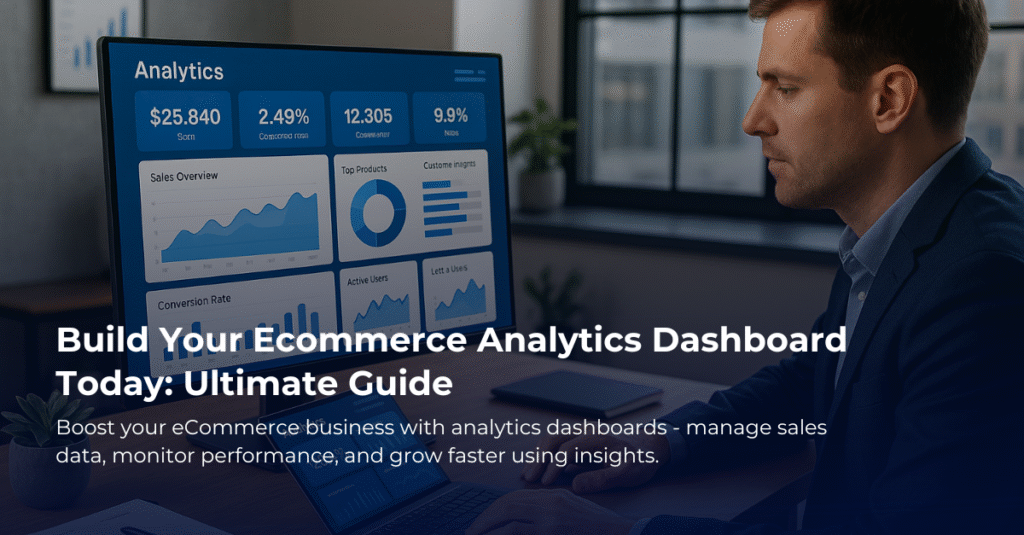
In simple terms, an ecommerce analytics dashboard is a visual tool that displays key performance indicators (KPIs) related to your online sales. Think of it as your business’s report card. It tells you how well you’re doing, what’s working, and where you might need to improve.
So, what types of information will you find on this dashboard? Here are a few key metrics that are often included:
- Sales data: How much revenue are you generating? Are your sales numbers increasing or decreasing over time?
- Traffic sources: Where are your visitors coming from? Are they finding you through social media, search engines, or other means?
- Customer behavior: What pages are they visiting? Are they adding items to their carts but not completing the purchase?
- Conversion rates: Of all the visitors to your site, how many are actually making a purchase?
Why Should You Build One?
You might be asking yourself, “Why should I go through the effort of building an analytics dashboard?” Here’s the deal. Having access to this kind of information can help you make informed decisions. For instance, if you notice that a specific product is selling like hotcakes, you might want to stock up on that item or promote it more. Or if traffic drops from a particular source, you can tweak your marketing strategy to improve it.
It’s also super handy for tracking the effectiveness of your marketing campaigns. If you run a promotion on social media, you can check your dashboard to see if it actually brought in more sales. It’s all about getting feedback so you can adjust and grow.
How to Get Started
Now that you’re sold on the idea, let’s talk about how to actually build one. Here are some straightforward steps:
- Identify your KPIs: Decide which metrics matter most to your business. It might be sales numbers, customer retention rates, or website traffic.
- Select your tools: There are many tools out there, like Google Analytics, Shopify Analytics, or custom solutions. Pick one that suits your needs and budget.
- Connect your data: Whether you’re using a pre-made tool or building your own dashboard, you’ll need to connect it to your data sources so it can pull in the information it needs.
- Design your dashboard: Make sure it’s user-friendly and easy to understand. You want this to be a tool that helps you make decisions, not a confusing mess.
- Review and adjust: Once your dashboard is up and running, don’t just set it and forget it. Regularly review the data, and adjust your strategies based on what you see.
In Conclusion
If you want to succeed in ecommerce, understanding your data is crucial. An analytics dashboard can help you keep your finger on the pulse of your business. It’s not just for tech experts; it’s a valuable tool for any seller who wants to grow and improve. So, are you ready to create your dashboard and start making data-driven decisions? Your coffee seemed to have given you a boost of inspiration—let’s put it to good use!